Across 1,015 JMC date forecasts matched to JMA observations from 2018–2025, the mean absolute error was 4.0 days for maple and 4.8 days for ginkgo. That measures timing differences for monitored city trees; it is not a guarantee for a trip or a forecast for a particular temple.
Who makes the forecast, and what does it predict?
The Japan Meteorological Corporation (JMC) publishes Japan's autumn-leaf forecast. JMA supplies the historical observations used in this check. They are different organizations and the two dates answer different roles in our comparison: JMC's predicted date for a city's monitored specimen tree, and the date JMA recorded that tree reaching its colouring threshold. The forecast is not a promise that every tree in that city—or every tree at a travel destination—will be coloured on that date.
That distinction matters if your trip is built around a particular place. A city-tree forecast can help describe the broad timing, but it cannot tell you whether a temple garden or mountain trail is at its best. For those, look for a dated report about the place itself. PeakYet keeps those two kinds of evidence separate on the Japan autumn leaves map.
How did we test it?
We matched JMC forecast dates from 2018 through 2025 with JMA's observed colouring dates for the corresponding city and tree. Of 1,075 forecast records collected, 1,015 had a usable matching observation. We excluded 60: in 46 cases no JMA colouring date was available for that city and year; in 14, colouring had already been observed by the forecast's release date. The archive has no JMC forecasts for 2020, and most cities have only a later maple round for 2018.
We report mean absolute error (MAE): the average number of days between the forecast and observed dates, ignoring which came first. A 4-day MAE means the two dates differed by four days on average; it does not mean every forecast was four days off. Signed error keeps the direction: actual date minus forecast, so a negative number means the tree coloured earlier than predicted.
| Tree | Matched dates | Mean absolute miss | Mean signed error | Within 5 days |
|---|---|---|---|---|
| Maple | 546 | 4.0 days | −1.2 days | 75% |
| Ginkgo | 469 | 4.8 days | −0.3 days | 64% |
Source: PeakYet backtest of JMC forecast dates against JMA observations. The maple and ginkgo samples differ.
How close were the dates, and did later updates help?
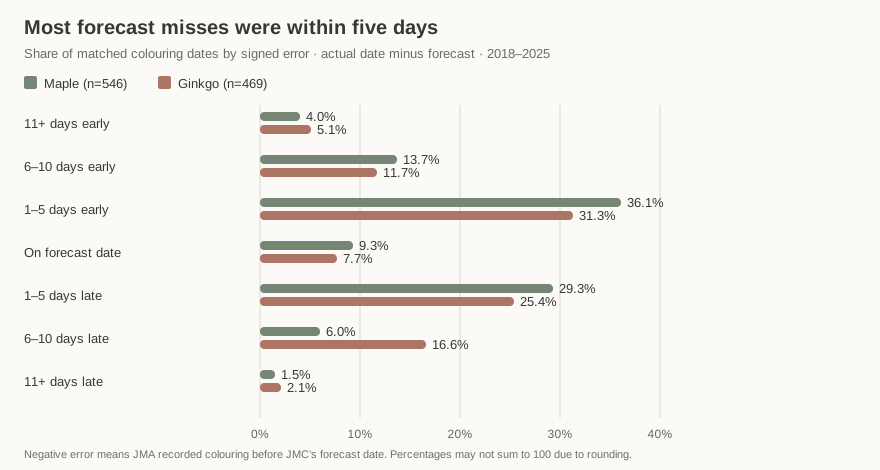
Across all matched forecasts, the maple date was within five days of JMA's observation in 75% of cases; ginkgo was within five days in 64%. The averages hide the direction and spread: maple colouring most often came one to five days before the forecast date, while ginkgo had a larger share of cases where colouring came six to ten days after it. The chart shows how often forecasts fell into each range, not just the average size of the miss.
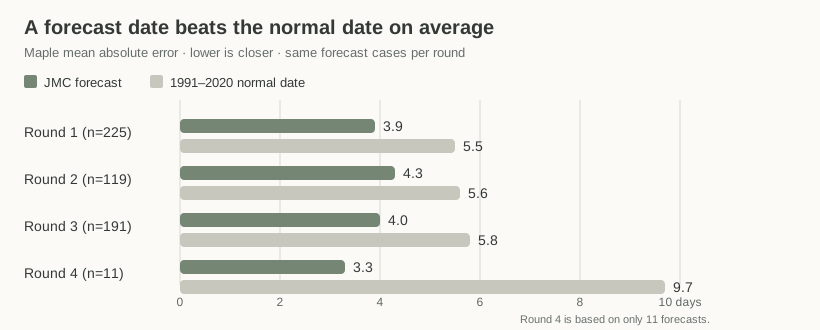
A later forecast round was not automatically more accurate in this history. Maple's first round had a 3.9-day MAE, the second 4.3 days, and the third 4.0 days. The fourth round's 3.3-day result comes from only 11 matched forecasts, too few to treat as a stable national result.
| JMC round | Matched dates | Mean absolute error | Within 5 days |
|---|---|---|---|
| 1 | 225 | 3.9 days | 77% |
| 2 | 119 | 4.3 days | 68% |
| 3 | 191 | 4.0 days | 75% |
| 4 | 11 | 3.3 days | 82% |
Did an update improve the same forecast?
The national round averages above mix different cities and years. This is the fairer comparison: the same city, tree and year, first judged with an earlier forecast and then with JMC's update. Updates sometimes helped. They did not reliably help every time.
| Update | Same cases | Average miss; closer / same / farther |
|---|---|---|
| Round 1 → 2 | 83 | 3.7 → 3.6 days; 29 / 27 / 27 |
| Round 2 → 3 | 81 | 3.7 → 4.0 days; 23 / 24 / 34 |
| Round 3 → 4 | 11 | 3.3 → 3.3 days; 4 / 2 / 5 |
| Update | Same cases | Average miss; closer / same / farther |
|---|---|---|
| Round 1 → 2 | 84 | 5.1 → 5.2 days; 21 / 38 / 25 |
| Round 2 → 3 | 75 | 4.5 → 4.2 days; 33 / 16 / 26 |
| Round 3 → 4 | 8 | 4.2 → 4.0 days; 4 / 1 / 3 |
The same matched dates also did better than using the 1991–2020 normal colouring date alone. For maple, JMC's round-one forecast had a 3.9-day MAE versus 5.5 days for the normal date; round two was 4.3 versus 5.6, and round three 4.0 versus 5.8. That supports using the forecast as information beyond a long-term average, while the remaining several-day error still matters to a traveller.
Where were errors largest?
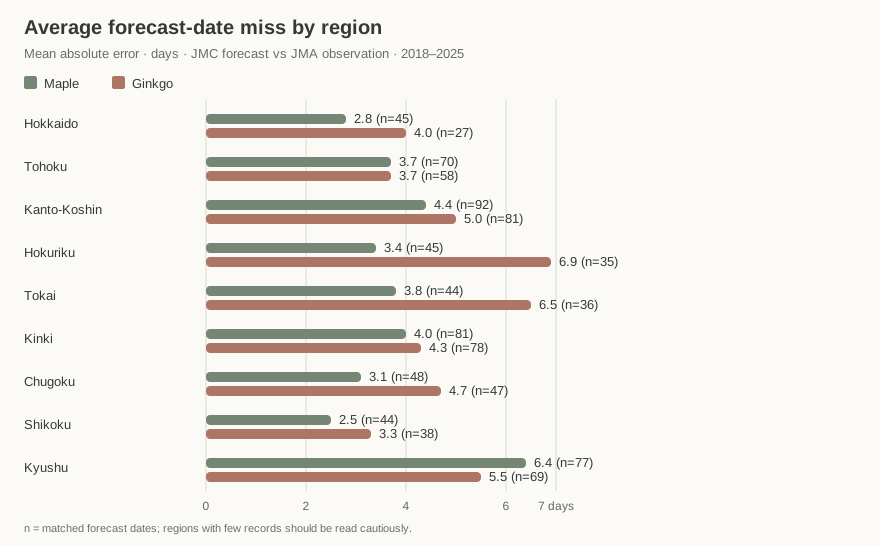
Kyushu had the largest regional maple miss in this sample: 6.4 days on average, with colouring 3.9 days earlier than forecast. Shikoku's maple MAE was 2.5 days. Ginkgo errors were largest in Hokuriku (6.9 days) and Tokai (6.5 days). The chart shows the matched sample size for each region as well as its average error.
Which cities had the steadiest forecast dates?
The charts rank cities with at least 14 usable forecasts. That leaves out thinner samples rather than making a handful of dates look as solid as a long record. Lower is better. Kyoto, Tokyo and Osaka were around three to four days for both trees; Kanazawa's ginkgo results were much less steady, at 11.4 days across 14 forecasts.
Why are some regions harder to predict? This backtest shows where the dates differed more, but it does not test the causes. It would be guesswork to attribute the regional pattern to elevation, weather or tree species from these results alone. There is also a year-wide effect: across the cities available in 2025, maple colouring came 3.3, 5.0 and 6.3 days earlier than the first, second and third forecast rounds' dates, respectively. The cities included differ between rounds, but the shared direction shows why a later release cannot remove every season-wide shift.
What does this mean for a traveller?
A forecast date is a starting point for planning, not a date to treat as certain. If your trip is fixed, the PeakYet Score estimates the chance that the monitored city tree's colouring-to-leaf-fall period overlaps a chosen day. It uses historical forecast errors and the recorded length of that tree's season. It does not turn a city-tree date into a prediction for a specific park; check that place's own dated reports as your trip approaches.
We tested the score separately from the date-error comparison. Leave-one-year-out validation covered 1,001 forecast cases (527 maple and 474 ginkgo) with enough history; when testing a year, its errors were held out from the estimate. Those forecast cases generated 32,147 maple and 28,914 ginkgo city-days for scoring. The daily records from one forecast are related, so they are not that many independent trips.
| Tree | PeakYet Score | JMC forecast alone |
|---|---|---|
| Maple | 0.0948 | 0.0994 |
| Ginkgo | 0.1010 | 0.1068 |
The score improved modestly over the JMC forecast alone in this backtest. In the 50–70% band, held-out maple and ginkgo city-days were in the tree's colouring-to-leaf-fall period 61% of the time. In the 70–90% band, the observed shares were 81% for maple and 77% for ginkgo. Those grouped historical results are close to the stated chances, but they describe monitored city trees—not the odds for an individual temple visit.
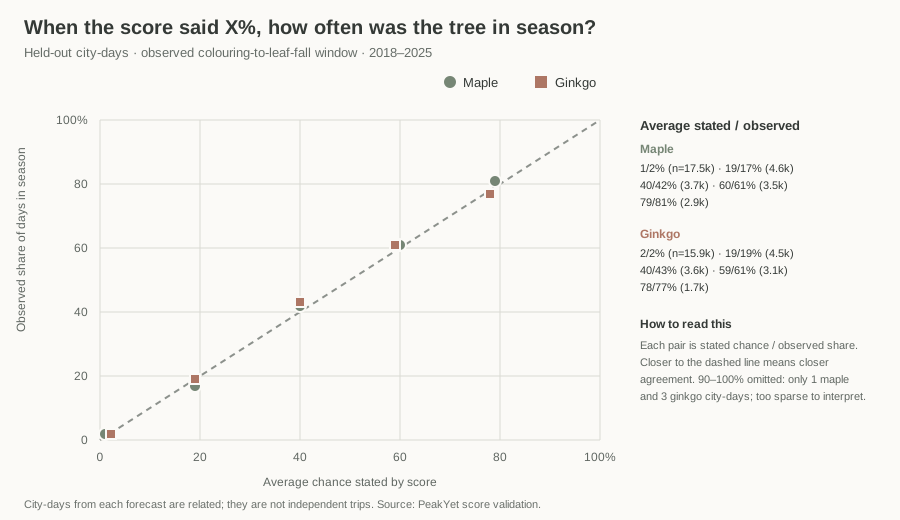
Source: PeakYet leave-one-year-out validation of the published score. Brier score evaluates probability forecasts against outcomes; lower is better.
What are the limits of this comparison?
This is a retrospective comparison of the records we could recover, not every forecast JMC has issued. 2020 is missing, 2018 coverage is partial, and 60 of the 1,075 collected records could not be used in the date-error test. The compiled research files are private, so readers cannot yet download the dataset and reproduce every calculation. The results describe specimen trees and historical seasons; they do not establish why one region differs from another or forecast the condition of a particular park this year.
For the method behind the live map, see About the data. To check named places, open the Japan autumn leaves map and follow the source links beside each dated report.
- How accurate is Japan's autumn leaves forecast?
- In PeakYet's 2018–2025 comparison, JMC's forecast date differed from JMA's observed date by a mean of 4.0 days for maple and 4.8 days for ginkgo (mean absolute error).
- Does JMC predict when Kyoto's temples will peak?
- No. The forecast is for a city specimen tree. Individual temples and parks can change at different times, so check dated reports for the place itself.
- Does a later forecast round always get closer?
- No. In this sample, maple's second-round mean absolute error was larger than the first round's. The fourth round's apparently lower error came from only 11 matched dates.
- Is the PeakYet chance score much better than JMC's forecast?
- The backtest shows a modest improvement over JMC's forecast alone. It estimates a city specimen tree's season, not the condition of a particular destination.
Sources
Back to Japan autumn leaves 2026: live status and forecastAll articles